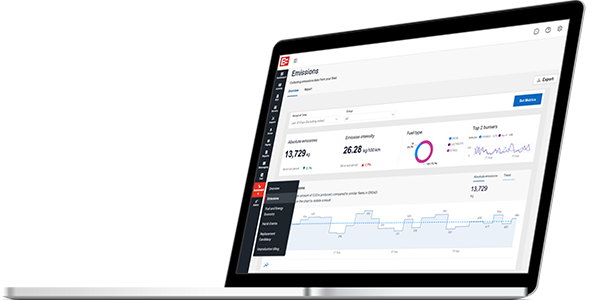
Fleet Management – MyEROAD Sustainability Module
The New Zealand government has a goal to reduce transport emissions by 41% by 2035, and freight emissions by 35%. Businesses should be prepared for potential changes to reporting requirements as well as changes to the types of vehicles that will be available.
A good place to start is making sure you’re getting accurate data and insights into your fleet operations. EROAD’s Sustainability Module provides multiple sustainability metrics and reports for fleets who are ready to start measuring, reporting and taking action to reduce emissions and save costs.
“Since installing EROAD, we’ve seen reduced carbon emissions, better driver behaviour, and more accurate mileage”
Mātanga Projects
Benefits
Find out more:
Key Features
EROAD’s Sustainability Module contains an array of data, insights, predictions and recommendations based on your connected fleet data. Helping you to measure, track, and report on emissions as well as review guidance on ways to make savings.
Reports available
Overview dashboard
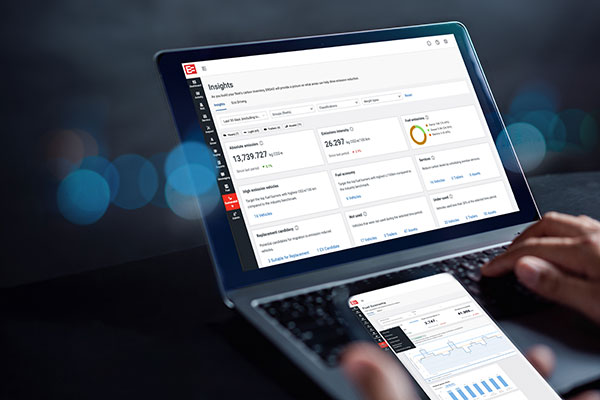
Overview of total emissions and how this compares to the previous period. You’ll also see a summary of key fleet efficiency insights and recommended actions to reduce emissions and improve performance against benchmark. No need to export data or create fancy graphs, simply present this visual performance dashboard to stakeholders!
Emissions report
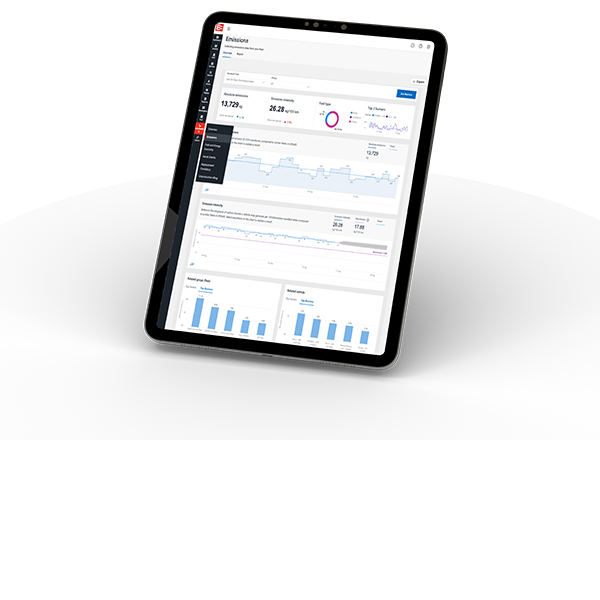
View emissions, emissions intensity and potential savings by whole of fleet, by group or by individual vehicle. View and share graphs of your absolute emissions and emissions intensity trends against benchmark over the selected period.
Fuel economy report
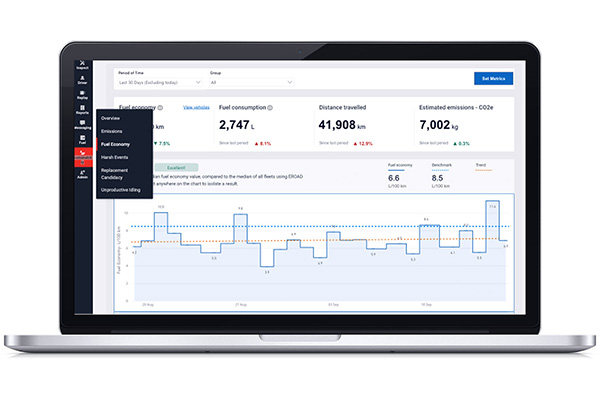
This report requires fuel data through the EROAD Fuel Management solution. Go deeper into what’s driving your fuel consumption and see at a glance how many litres of fuel per kilometre your fleet is using. See which groups, vehicles or drivers have the highest and lowest fuel burn and understand the impact of unproductive idling.
Vehicle replacement suitability report
Want to start transitioning your fleet to low and zero emission models but don’t know where to start? This report predicts the potential fuel savings and emissions savings if vehicles were replaced with suitable alternatives in their class/category. It also rates whether each vehicle could likely be replaced by an EV or low emission model.
Idling report
Idling may not be a crime in New Zealand, but it could be stealing money from your business. The idle report in EROAD’s Sustainability Module will give you a clearer picture of your fleet’s idling activity. The customisable idling range gives you more control over the report, to help make sure it’s in line with your company’s policies.
Harsh driving report
The harsh driving report pulls together multiple metrics across your fleet to provide a per vehicle breakdown of total CO2 emissions, emissions intensity, idling time and total kilometres of speeding. This can help you identify drivers who may benefit from some additional coaching.
Benchmark your fleet against thousands of others
The MyEROAD Sustainability Module not only provides you with insights into your fleet’s emissions, but it also helps you to benchmark your company’s performance against fleets that are similar to yours in size and type. See in real-time whether you’re above or below the benchmark, and get recommendations for ways to improve.
What better way to understand where you sit against the competition.
Transparent sustainability reporting is on the rise
Many listed companies in New Zealand are now required to report on their emissions but many more are choosing to provide sustainability reporting on a voluntary basis. The rise in ESG reporting means many companies are seeking ways to reduce both their own, and their supply chain emissions.
83%* of large fleets say customers are asking them to provide sustainability performance information in contract negotiations.
To remain competitive, and continue to win new customer business, fleets are going to need easily accessible and up-to-date sustainability metrics that can demonstrate progress and help customers with their own scope 3 emissions reporting.
*EROAD Sustainability Survey 2023, conducted between June – July 2023 across 1266 fleet professionals.
Vehicle tracking solutions
The MyEROAD Sustainability Module requires a connected fleet, fitted out with EROAD GPS vehicle tracking hardware.
The module is one component of EROAD’s fleet management software which helps thousands of customers globally to improve driver safety, reduce operational costs and maximise their fleet productivity.

